By Wendy Bacon, Luke Bacon and Henare Degan
This is the third part in our series on WestConnex and air quality, a key topic of concern that was raised in thousands of submissions objecting to the project. In this story, we take a closer look at the air quality monitoring that must be conducted for 12 continuous months before the M4 East tunnel is opened.
Negative Values
Soon after we started following the WestConnex Ecotech air quality monitoring website, we began to notice negative values for the particle pollution measurements. For example, instead of "20 ug/m3 PM 10", we saw "-20 ug/m3".
These below zero results mostly occurred for PM 10 recordings, but also for PM 2.5. (For more on PM 2.5, PM 10, and Particulate Matter in general, read Part One and see the useful Wikipedia article on Particulates).
We're not just talking about a few negatives. We've observed hundreds of negative results including some above - 100. Since March 16 alone, more than 35 results have been below - 50. The greatest number have been published from the Haberfield Public School air quality monitor, which has produced more that 200 negative results in the period.
These negative results raise many questions. Are these results counted in the final average results? How do they affect the results before or after them? Why do they occur at all?
We want to get to the bottom of this issue so we contacted Environmental Justice Australia (EJA) Air Quality researcher Dr. James Whelan who has extensive experience working with air pollution caused by coal mines in the Hunter Valley. He replied:
It is not extraordinary for monitoring equipment to generate data that includes some negative numbers. But air pollution concentrations cannot be negative. Even environments far from industry and other pollution sources have low (positive) concentrations of many toxic pollutants.
Dr Whelan was not surprised by the appearance of a few negative values, but he expected these to be quite low in value. For example, here's a recent sample from the NSW Office of Environment and Heritage (OEH) website:
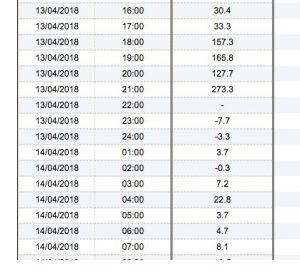
This screenshot of the OEH Macquarie Park monitor last Friday evening shows very high levels of PM 10, which were apparently caused by a 'burn off' on the northern outskirts of Sydney. As the smoke cleared around 10 pm, the levels recorded plummeted. There was no data recorded for an hour, then there were a few negative results until the monitor started recording positive values again early Saturday morning.
So it's not unusual for negative results to be recorded, but they are not a valid reading of the particulate matter in the air, which cannot be less than 0 parts per measurement. We don't yet know why air quality monitors occasionally produce these invalid recordings.
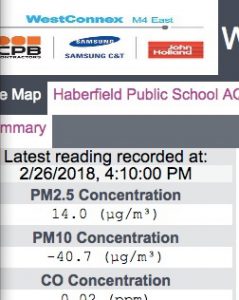
To compare to the low negative recordings from the OEH monitor, here's a screenshot from the WestConnex Ecotech real-time monitor on February 26, 2018. As you can see, this negative result of -40.7 ug/m3 PM 10 is significantly higher those on OEH site of -7.7, -3.3, and -0.3.
A high number of invalid negative results have proved to be a problem with industry air quality monitors in the Hunter Valley. Monitoring in the Namoi Valley has been transferred from mining companies to the NSW government's OEH monitoring network partly because of a high occurrence of negative results.
We emailed a table of higher negative results to Dr Whelan asking him for his opinion.
He replied:
EJA [Environmental Justice Australia] have previously audited monitoring data collected by NSW coal mines and discovered companies reporting negative concentrations of air pollution. We have never before observed such high values for negative air pollution concentrations as we see in the Westconnex data.
What happens to the negative results? Are they included in final results?
Air quality monitoring is only worth doing if it has credibility.
Ecotech declined to answer any questions and referred us back to the Sydney Motorway Corporation. Ten days ago, Wendy sent Sydney Motorway Corporation (SMC) some questions. These were included:
Ecotech monitors are showing a lot of high PM 10 negative results. There are obvious errors. What explanation does Ecotech have for these? Can you please ask Ecotech to provide an explanation of how these will be dealt with in the validation exercise? What do those negatives indicate about the likely accuracy of the results shortly before the negatives?
How often are the monitors currently maintained? Once a month or more often? ( We now know from the monthly reports that the PM instruments are calibrated and maintained every 3 months).
Is there someone or some people at SMC or the M4 East project that I could talk to about these matters? If so, could you assist me in being able to speak to them?
Yesterday afternoon, we received a response from SMC. There were no answers to our questions but instead received a statement of policy, approval conditions and formal procedures, all of which we already knew. This blocking tactic is standard practice for the SMC in its dealings with journalists and complaints from the public.
Community groups have also been trying to get answers. Co-convenor of No WestConnex Public Transport Now Paul Jeffreys was concerned about the high levels of pollution being recorded and the negative results that could mask even higher results. He did manage to speak to several people but none of his questions were answered. He told us, "They either don't have enough expertise or don't want to answer the questions. I'm deeply concerned about air quality but feel that the Sydney Motorway Corporation doesn’t care."
What can you find out on the Ecotech site?
You can observe the 'real time' readings on the Ecotech website.
At first glance, you wouldn't know that the results on the screen aren't final results. In fact, there's no explanation at all on the front page about what the results in the sidebar mean. Are they hourly results or daily results? It's not clear.
Only if you click on 'Information' do you read at the bottom of the page:
The data on this page has only gone through preliminary quality assurance checks. This data may require modification during the final stages of validation as a result of calibration changes, power failures and instrument failures.
There is no mention of negative values and no explanation of where you would find the results after they have undergone 'quality assurance'.
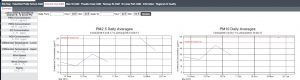
The final validated air quality reports are published on the Westconnex website about five weeks after the end of the month the report represents. They are not linked to the real-time monitoring site. The M4 East monitors were turned on in mid-December and so far there have been two reports: January and February.
The reports include the daily average for PM 10 and 2.5 for the previous month, and an update for the year so far. There is a line graph comparing sites, but no rolling daily averages, no eight-hour averages, and no daily maximum and minimum, which are commonly included in air quality reports.
These reports include a table which provides a brief explanation of why data has been removed. Here is an extract from the February report:
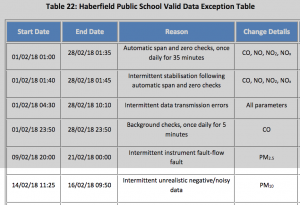
According to the report, this table lists "changes made to the raw data set during the validation process" (section 6.0), in this case 'Intermittent unrealistic negative/noisy data' for their PM 10 recordings between 14/02/18 11:25 and 16/02/18 09:50. Similar entries occur for each site.
No explanation is given in the report of how many negative results were changed or how high they were. Are they replaced with a zero or removed altogether from the averages? How do the results vary before and after validation? Why are so many negative results happening? None of this information or methodology is made public.
So we've learned that negative results are in-fact filtered out as 'exceptions' before average pollution level calculations are made. But this knowledge was not easily accessible, and there is little explanation for people trying to understand the risks from particulate pollution around the M4 East project.
By comparing some daily averages with and without negative results, we concluded that once the negatives are extracted, the averages on the Ecotech site will be a bit higher in the final monthly report. Because so many 2018 results are so far averaging above or close to the national air quality limits, the specifics of the methodology used by WestConnex and Ecotech are crucial information for members of the public wanting to understand the project's impact.
Another problem with the monitoring results
We observed other problems with the air quality monitoring.
For example, during the evening of March 18 the PM pollution levels in the Sydney basin began to rise quickly, including along the M4 East. Levels remained very high for a day or two and exceeded national limits at five of six M4 East air quality monitoring sites. During this period, the monitor at Concord Park on Parramatta Rd stopped reporting results, and did not start again until in the afternoon of March 19.
This means that the validated March results for Concord Park will be lower than they were in reality, because the monitors were shut down for a period of high pollution. Did anyone notice that the monitor was down? Why wasn't it fixed?
We have also noticed that while the 'information' page on the Ecotech site states that recordings are taken at five-minute intervals, the PM 10 real-time monitoring data is updated every 10 minutes and the PM 2.5 once an hour.
Why does the quality of the air quality monitoring matter?
Thousands of submissions objecting to the WestConnex EIS for Stages 1, 2 and 3 expressed concerns about air quality. Now, thousands of residents believe their health and quality of life has already been worsened by dust and contamination from WestConnex sites. Sydney dependency on cars and tollways is a major public health issue.
Pollution stacks
The monitoring is intended to measure the air pollution before and after the opening of unfiltered pollution stacks at either end of the M4 East tunnels. The results of the air monitoring are a sensitive political matter, especially for Premier Gladys Berejiklian who strenuously opposed them in her own electorate when she was in opposition. Ex Planning Minister now Education Minister Rob Stokes has also publicly opposed unfiltered stacks on Sydney's Northshore. He approved the M4 East and New M5 projects on condition that the air around M4 East project would be strictly monitored before and after the tunnel was opened. This was his way of political smoothing over his approval of the stacks.
Whatever the results, it is unlikely that the monitoring will convince the public of the safety of the stacks. Long term impacts on cancer rates and other serious illnesses will take years to emerge. The process, like the EIS process itself, is designed to enable the government to state that the stacks are safe. In fact, the decision to locate all the monitors on the northern side of Parramatta Rd means that thousands of residents living on the southern side of the stacks will not have their air monitored at all.
Question marks hanging over the credibility of data further erode confidence in the results of the monitoring exercise, even before the stacks at Homebush and Haberfield are built.
Roadside pollution
Quite apart from the stacks, the air quality results provide a rare and important glimpse into air quality near some roads and road construction sites near the Westconnex project. The OEH have no roadside monitors in Sydney. For this reason, there is a very strong public interest in the quality of this air quality monitoring data, especially for those living near massive road construction sites and near tunnel portals. There is already plenty of international evidence that living near congested roads can have serious health consequences. The Ecotech monitoring results can provide the community with more useful local evidence about pollution levels near motorways in Sydney.
NSW Roads and Maritime Services have continually sort to downplay air quality problems caused by roads and road construction in Sydney. In fact, construction impacts were not even quantitatively evaluated in the WestConnex Environmental Impact Statements (EIS). The data published on the Echotech website and by WestConnex provides an opportunity to evaluate those assumptions.
Many other experts including James Whelan are already concerned about urban air pollution in Sydney.
We are concerned that this part of Sydney already experiences harmful concentrations of both coarse particles (PM10) and fine particle (PM2.5) pollution. There is no safe concentration of particle pollution and it contributes to the premature death of more than 3000 Australians each year. This is of particular concern in locations where young people spend their days, such as schools. In fact, particle pollution in this airshed exceeds national air pollution standards regularly.
The Department of Environment and Energy says that these standards are "are legally binding on each level of Government", but what information and legal means do people really have to prevent the air they live in being polluted and their health being damaged?
So far the monitoring data for December to mid-April suggests that pollution levels were underestimated by WestConnex in their planning and EIS. (We will come back to this issue in further posts. If you have more information about these issues, please contact us to assist us in reporting it to the public).

Construction Impacts
There is a huge amount of anecdotal and some medical evidence that WestConnex is negatively impacting the quality of life and health of residents on much more than the predicted 'temporary' basis. Analysis of this air quality data could help confirm that qualitative evidence.
The community should be able to access and interrogate the Ecotech data more easily and to understand its strengths and weaknesses. At the moment, emphasis on broad averages disguises other issues, such as when pollution peaks occur over a 24 hour period, or the averages around school and peak traffic hours compared to the rest of the time.
Introducing AECOM/Ecotech?
Before we started investigating air quality in relation to WestConnex earlier this year, none of us had ever heard of Ecotech which owns and maintains the air quality monitoring stations along the route of the M4 East.
We now know Ecotech is a well-established and experienced air monitoring company based in Melbourne. Since 2012, it has expanded into the growing Indian market. In February last year, Ecotech merged with a much bigger French company ACOEM group that already had subsidiaries in Sweden, Brazil and Malaysia (not to be confused with AECOM, another company significantly profiting off WestConnex). Together the companies employ 600 people and receive about $68 million annual revenue, which ACOEM group plans to double by 2020 through international expansion.
With all ACOEM's skills and experience, it would be great for the community to have the company on our side in dealing with concerns about air quality. Unfortunately, residents who've tried to speak to the company have not even been able to talk to them. Nor have we. This is due to the fact that ACOEM is under contract and bound to secrecy by commercial arrangements with CPB Contractors, John Holland and Samsung, who are being paid $2.7 billion to design and build WestConnex M4 East. A small part of those billions is being paid to Ecotech/ACOEM, which also has the contract for the New M5 to conduct its air monitoring. We understand each monitoring station costs about $100,000 with servicing fees on top. The contract will be worth millions a year to ACOEM.
Why is the consortium that is building the WestConnex M4 East being paid to monitor air quality impacts, especially given the controversial and potentially serious public health risks involved? It appears to us that the consortium has a massive conflict of interest here.
Dr Whelan believes that communities have a right to know the results of air quality monitoring:
Communities have a right to know what they are breathing, and to have confidence in air pollution monitoring and advice. Polluters clearly should not be responsible for either monitoring air pollution or reporting monitoring results to the community, especially if they have been found to be misrepresenting results.
We're not suggesting that Ecotech are misrepresenting results. We are however suggesting that there are is a question-mark over the quality and presentation of the data and that the public has a right to full and clear explanations. Why is there so little transparency in the reporting? Why is the search engine on the site limited to 30 days rather than the entire monitoring period?
Lack of accountability and conflicts of interest are problems that come up constantly in relation to WestConnex. They are a symptom of a failure of accountability and secrecy that pervades NSW Planning. For example, AECOM (a different global company) that was commissioned to do the Environmental Impact Statements for all three WestConnex stages has had commercial interests in the massive project from its beginnings in 2012. While NSW Planning is assessing its EIS for Stage 3, AECOM has contracts with NSW Planning to work on other projects. AECOM refused to answer any journalism questions about WestConex on the grounds that the company is contracted to WestConnex.
Watch for more in our series about WestConnex and Air Quality. Read Part one and two and an earlier story about how schools and child care centres will have worse air quality if Stage 3 is approved.
If you have any information about WestConnex’s planning, operations, or air quality monitoring, or have been impacted by pollution around Sydney’s motorways, please contact us.