You may not be able to see it but it's the deadliest form of air pollution. It can penetrate deep into the lungs and bloodstream, causing heart attacks, lung cancer, and premature death. It's called particulate matter, also known as particle pollution or PM.
Over the last month, I've been investigating Particulate Matter in the context of WestConnex. The results are disturbing. So far, this year air pollution has exceeded daily average national goals on at least 10 occasions along the route of the WestConnex M4 East, a tunnel between Homebush and Haberfield that is expected to open next year. Daily exceedances of national goals are supposed to be rare in Sydney.
Before I report in more detail on the results of my investigation, I need to explain some background information. If you already know these facts, you can skip to the results section.
PM, roads and your health
Particulate matter is extremely small solid particles and liquid droplets suspended in air. PM10 is 10 micrometers or less in diameter, PM2.5 is 2.5 micrometers or less in diameter. There are also even smaller ultrafine particles that are not currently measured in Australia.
Short or long exposure to PM can damage your health. The smaller the particle the more dangerous it is. There are no known safe levels of PM 2.5. As well as being linked to cancer and heart disease, PM can also worsen pre-existing respiratory illnesses including asthma. These facts have been well established by scientific research.
More recently, research has shown that PM 2.5 may be linked to increased risks of dementia.
Vehicle emissions, especially diesel, contain PM. Government departments responsible for health, environment, transport and urban planning have known for years that living close to busy roads increases health risks due to PM exposure.
In 2017, University of Sydney Professor of Respiratory Medicine Paul Torzillo told a meeting in Camperdown (where a major WestConnex Stage 3 construction site is planned) that,
Every major program and project like this around the world leads to more cars and more vehicles coming into cities. It's been very well looked at by a number of research groups. Every single infrastructure project like this leads to more cars and more vehicles coming into cities and you have a greater contribution to air pollution from traffic-related pollution.
Traffic-related pollution – there is a huge amount of evidence that air pollution increases death from cardiovascular disease, that's the leading cause of death in Australia. It leads to increased hospital admissions from heart disease. It leads to increased stroke. It leads to increased respiratory disease, and it leads to increased deaths from respiratory disease. It leads to higher rates of low birth weight in kids. And there are major reviews by WHO that occur every few years or from groups that are consulted by them and every time one of these reviews occurs the evidence about the strength of the relationship between pollution and bad health get stronger and stronger. There's no question about this…...It's absolutely true that pollution levels for half a kilometer each side of roads are much higher than they are outside that. Pollution levels will be higher at entry and exit points. They'll be higher at stack points. But there are big measurement problems here.
Watch of the video of Professor Torzillo's speech.
Measuring Particle Pollution
The NSW Office of Environment and Heritage (OEH) measures PM 10 and PM 2.5 in accordance with national standards. (Two weeks ago City of Sydney Deputy Mayor Jess Miller raised concerns about the effectiveness of this OEH monitoring because some OEH monitors do not meet national standards. I'll discuss this further in another post.)
National Standards
PM 10
An annual average of 25.0 μg/m3 (micrograms per cubic meter). Victoria wanted 20 but NSW would not agree. Victoria has adopted the stronger standard for itself.
Average 24-hour levels must be no higher than 50 µg/m3.
PM 2.5
An annual average of 8.0 μg/m3 and a 24-hour average of 25.0 μg/m3.
No exceedances are allowed.
Exceptional events
In 2016, Federal and State governments introduced the National Environment Protection (Ambient Air Quality) Measure (NEPM) 'exceptional event' rule for determining compliance against PM10 and PM2.5 goals:
Exceptional event means a fire or dust occurrence that adversely affects air quality at a particular location, and causes an exceedance of 1 day average standards in excess of normal historical fluctuations and background levels, and is directly related to: bushfire; jurisdiction authorised hazard reduction burning; or continental scale windblown dust.
Any exceedance day deemed to be ‘exceptional’ is not included when determining compliance with NEPM goals, while an exceedance determined to be a ‘non-exceptional’ event is (NEPM Section 18, 3C and 3D). Note that 'exceptional' is defined narrowly. A hot and dusty day in Sydney does not qualify, and does count against the goals, unless it is during seasonal burn-off, directly linked to an actual fire, or a continental scale dust storm.
Westconnex M4 East and Air quality.
Construction of the M4 East has now been underway for two years. However, back in 2015, it had not yet been approved. With all this evidence about PM available, it’s not surprising that residents who live or have children attending schools near:
- major construction sites serviced by heavy diesel trucks
- future portals where traffic will concentrate
- unfiltered ventilation stacks
- major roads that will become busier due to toll avoidance
and many other citizens and health professionals were concerned about how the project would negatively affect air quality, both during construction and after the tunnel opens. At WestConnex EIS sessions, NSW Roads and Maritime Services representatives were like a broken record, constantly reassuring residents that their concerns were unfounded. But residents and community action groups didn't trust them and submitted thousands of submissions to NSW Planning objecting to WestCONnex M4 East on the grounds of air quality. Councils' hired independent experts whose analysis found major flaws in the WestConnex EIS.
Jozefa Sobski, a highly respected retired senior public servant recently awarded an Order of Australia for her services to women, included these words in her submission:
The air quality issues have not been addressed. The ventilation stacks will be close to Haberfield Public School, the Infant’s Home and residents of Walker Avenue, Ramsay Street and Denham. What scientific proof will be provided that air quality will not be considerably affected for the worse during and after construction is complete?
On November 15, 2015, the Inner West Courier reported:
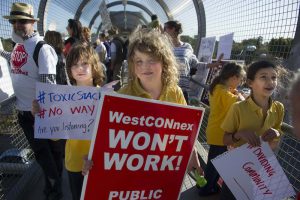
“The parents at Haberfield Public School fear our children will be at the centre of a toxic triangle of pollution stack and portals after three or more years of construction just metres away from the school,” Haberfield Public School P & C vice president Sherrill Nixon said. Ms Nixon said the streets around Haberfield Public School will see three years of noise and heavy truck movements during construction, only to end up with polluting exhaust stacks less than 500m away.
“The impact on our school community is devastating,” she said. “We insist our kids’ learning and wellbeing comes first.”
Read Sharon Laura's submission. Her home is 150 metres from the Ashfield/Haberfield interchange, 300 metres from the Stage 1 and Stage 3 tunnel ventilation stacks, and 600 metres from the City West Link, Haberfield interchange. All of these are currently being constructed. In her submission, she expressed concerns about the impact of diesel trucks, hundreds of which now move around Haberfield each day. She wrote:
I also object to the increase in localised pollution around construction sites. In particular around the Parramatta Rd construction exit onto Bland St, Ashfield by large numbers of diesel vehicles heavily laden, revving up or idling and thus spewing out the most dangerous pollutants. Pollutants which will sit and hang low around the natural gully which surrounds the Parramatta Rd and Bland St intersection, and pollutants that may not disperse quickly or at all, – depending on the local weather conditions and volume of trucks using this location.
In other words, many citizens, councillors, local MPs and action groups did all in their power to warn of the potential harm that could be done to residents and workers. The problem is that no one listened or if they did, they were not prepared to refuse the WestCONnex M4 East application.
In its response, WestConnex EIS dismissed construction impacts as ‘temporary' and not sufficiently significant to quantify. Temporary in this case can be as long as three years or even six years if you are unlucky enough to live in St Peters Haberfield or parts of Ashfield. This could encompass a child's first five years or his or her primary school years. It is not temporary. Nevertheless NSW Planning adopted this view.
Under political pressure from the NSW LNP government, NSW Planning overrode the concerns of Councils, residents and independent health experts and approved the M4 East.
Monitoring along the M4East
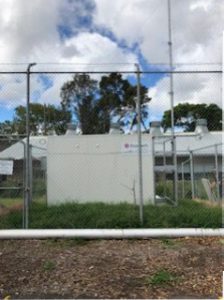
The Sydney Motorway Corporation is currently operating 6 monitors along the route of the M4 East, which will open next year along with two huge unfiltered ventilation stacks. One stack is in Homebush, the other in Haberfield. NSW Planning requires the monitors to be operated for one year before the tunnel opens. The monitoring is designed to reveal the impacts of the stacks on local air quality. There are a lot of problems with this strategy, which is aimed at allaying residents' concerns.
Planning does not require any monitoring to measure the impacts on residents living near the tunnel portals or of the construction impacts that last for years. Nevertheless, the SMC monitoring is useful and provides us with a rare glimpse of air quality in the Inner West Parramatta Road corridor and evidence to use in evaluating WestConnex's environmental claims for the M4 East and other WestConnex projects, the Western Harbour Tunnel, the F6 and Northern Beaches Link.
Sydney Motorway Corporation, which controls WestConnex, hired a company called Ecotech to do the monitoring. The monitors were turned on in mid-December 2017. Since February, I have been taking snapshots of the data on the website. The data shows the average 24 hour level ( at one point each day) and the average so far for the year (only 3 months of 12).
The readings are taken at ten-minute intervals. Frustratingly, the data disappears altogether after 30 days. Also, no rolling hourly averages are shown, which means that peaks during the day are hidden from view. This means that the daily average graphs are rathre misleading because they have a straight line from one point in the day to a point in the next. By comparison, the NSW OEH monitors show rolling hourly averages.
The hourly averages can only be calculated by following the website closely. So far I have taken many snapshots of the data. Getting a more nuanced picture is important because the short-term effects of both PM 10 and 2.5 can be serious.
The data published on SMC Ecotech website has to go through a validation process before it used for monthly reports, which only include very general results. So far there has only been one monthly report—I will come back to that in another post.
Measuring and predicting air quality is a highly complex and technical matter but some basic points can be made. Local air quality strongly reflects broader regional air quality. It can also reflect local impacts including dusty construction sites and nearby traffic. In following the website, it quickly becomes apparent that wind direction is a strong influence at all locations. Wind changes in Sydney are very frequent and can cause readings to go quite rapidly up and down. It's important to remember that when the wind changes, it may be blowing pollution across the road or to another suburb. The monitors only measure the air quality at one particular location. The air quality may be better or worse at other locations in the area. For example, nearby trees can reduce levels of pollution.
I will begin with some reporting about Haberfield.
Results
In this post, I will report only on the two of 6 M4 East monitors that are in Haberfield.
Haberfield
Haberfield has been suffering the impacts of WestConnex for more than two years. Hundreds of homes and trees were torn down. Huge construction sites were established. Road building, tunneling and spoil recovery happens 24 hours a day. When the road opens there will be portals on both Wattle Street and Parramatta Road. If Stage 3 is approved, there will be more construction sites for another three years.
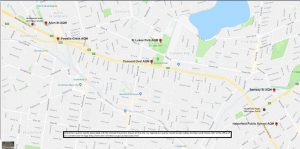
There are two monitors in Haberfield, one at Haberfield Public School and one at Ramsay Street.
Haberfield Public School
Haberfield Public School (HPS) fronts Bland Street. With the school’s approval, a monitor was placed at the back of the school. It is 200 metres from Parramatta Rd which is a major traffic route and the site of a future portal. Currently the road is being widened and the portal constructed. The HPS monitor is about 410 metres from the location of the unfiltered ventilation stack.
So far the results at the monitor for Haberfield Public School are worrying. However only three months of data have been collected, so the annual average is only an indication of the trends.
PM 2.5
According to the January report (the actual results are no longer on the website), the average for was 9 µg/m³. Since I started monitoring the site in early February, the average has been slowly rising until it is now just over 10 µg/m³.
Here is a search I did of PM 2.5 between February 7th and March 7th 2018.
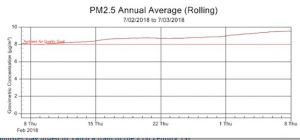
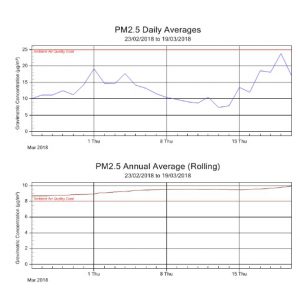
This snapshot below of a graph of Haberfield School average daily levels of PM 2.5 between February 23 and March 7 shows that the levels were only below 10 μg/m3 on a few days. Not surprisingly, the annual average graph was climbing steadily towards 10 μg/m3. The spikes in levels show the weaknesses of measuring only averages.
On March 5, the daily average reached 23 μg/m3, only two below a national exceedance.
PM 10
On February 15, the PM 10 daily average shot up to just over 50 μg/m3. (Some of the other five WestCONnex monitors also recorded more than 50 μg/m3 on that day.) If this was a NSW OEH site, that would be a national exceedance unless it was later classed as an 'exceptional event'.
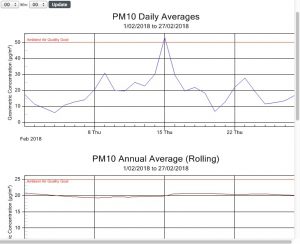
This is a screenshot of a search I did of PM 10 levels at Haberfield Public School between February 1 and 27, 2018. This graph also shows that the annual average for PM 10 so far this year is hovering around the 20 μg/m3. If we were in Victoria, anything above 20 μg/m3 would be an exceedance for a full 12 months.
It shows the daily exceedance on February 15 but doesn't show that on February 23 around midday, the PM 10 climbed to 131 μg/m3. One of the disadvantages of averages is that it doesn't show the peaks and troughs. The data could easily presented in a way that showed the variation and still show the averages.
Ramsay Street
The Ramsay Street monitor is about 100 metres west of the corner of Wattle Street and Ramsay Street. Major construction work is happening not far away. It's also near a very busy road which would be expected to get even busier when the tunnel portal opens nearby. Many trees in this area have been destroyed, including very large ones. Trees help reduce PM.
The results at this monitor are also disturbing.
There has been at least one exceedance of the PM 2.5 daily average of 25 μg/m3. The annual average for PM 10 is about 9.6 μg/m3 for the first three months of the year. There have been at least 3 days exceedance of the daily average limit of 50 μg/m3 for PM 10. The annual average for PM 10 is so far showing at about 23 μg/m3, which is only two below the national daily average limit of 25 μg/m3. This is well above the limit that has been agreed to in Victoria.
A bad day in Sydney
The weather last Sunday, March 18th was usually hot and gusty for a Sydney autumn day. Temperatures soared across Sydney and by late afternoon the PM 10 levels were climbing. The weather was unusual but is likely to become more common as climate change progresses.
In the evening, I checked the website and noticed some very high levels of PM 10, both at Haberfield School and the site of the Ramsay Street monitor. Night work was scheduled near the corner of Ramsay Street and Wattle Streets. not far from the Ramsay Street monitor.
According to the website, at 8.30 pm, the PM 2.5 level at Ramsay Street was an extraordinarily high 51 μg/m3 and the PM 10 was 48 μg/m3. At Haberfield School, the levels were 15 μg/m3 for PM 2.5 and 68 μg/m3 for PM 10. Ten minutes later, the levels remained nearly the same at Haberfield school but at Ramsay Street, the PM 2.5 was still very high at 51 μg/m3 and the PM 10 levels had shot up to 112 μg/m3. At 9.50 pm, the Ramsay Street levels remained the same for PM 2.5 μg/m3 and had climbed to 88 for PM 10.
I wanted the check whether levels were rising at other monitors in Sydney on the OEH site on which rolling daily averages get updated hourly. Unfortunately, the OEH website for that page was not working and was not fixed until Monday morning. I later confirmed that the levels were high for PM 10 but mostly not nearly as high as Ramsay Street.
By 9.10 pm, at Haberfield School, the website showed PM 2.5 had increased to 21 and the PM 10 to 54 μg/m3. By this time, the PM 2.5 levels at Ramsay Street had dropped back to 12 μg/m3 but the PM 10 was an extraordinary 438 μg/m3. Twenty minutes later it was still at that level at 9.30 pm. The PM 10 was also rising higher at Haberfield School.
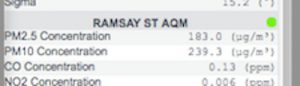
At 10 pm, the air quality had deteriorated even further. By this time the PM 10 levels at Haberfield School was 260 μg/m3 and the PM 2.5 was at 23. Other sites along the route were also high. Ramsay Street PM 10 had dropped back to 239 μg/m3 but even more worrying the more dangerous PM 2.5 was 183 μg/m3 where it stayed until sometime between 10.50 and midnight. In case, you don't believe me, I took a snapshot.
I would like to know what caused the very high levels of PM 2.5 at Ramsay Street on Sunday night. While the PM 10 levels were high (although mostly not nearly as high) at monitors across the region, the PM 2.5 levels were much lower elsewhere. Does WestConnex have monitors on site? Were workers including young night traffic controllers warned? If the levels were that high at the monitor, could they have been even higher elsewhere? How many residents were exposed?
When early risers were getting up around Haberfield School on March 19th, the PM 2.5 levels were 27 μg/m3. At midday, the PM 2.5 was 30 μg/m3. By the time children were getting ready to leave school, the PM 2.5 was still 27 and PM 10 was 117 μg/m3.
According to the OEH website, it appears that only at Liverpool in Sydney's South West were PM 2.5 levels nearly as high as at Haberfield School for most of Monday, March 19th. (The fact that there was somewhere else in Sydney was as bad as Haberfield, doesn't make the situation any better.)
On March 20th, between 6 am and 2 pm, the PM 10 levels at Haberfield School averaged approximately 65 μg/m3. For short periods, the level was higher than 110 μg/m3. This observation is for 8 hours so it does not represent another national exceedance. It does, however, provide evidence of the air quality experienced by children at school that day.
As I finish writing this report, it's now 9.30 pm on the evening of March 22nd. The air has cooled and it has been pouring for hours. The wind is low. The levels of PM 10 have gone down in Haberfield and elsewhere in Sydney. When I last checked at 8.10 pm on Thursday, the PM 2.5 level at Haberfield School was 10 μg/m3 and at Ramsay Street, 13 μg/m3. This is higher than other monitors across Sydney.
Update: When I checked the Ecotech website at 8 am today, the PM 2.5 levels were 12 μg/m3 and 11 μg/m3.
Conclusion
I have a lot more information and analysis to present about air quality, including about other sites along the M4 East. I would appreciate any assistance with further information or analysis.
Apart from being seriously concerned about the impact of WestConnex on the health of Sydney's communities, there are several specific issues that concern me.
How does this information reflect on the methodology and results of the AIr Quality report in the WestConnex EIS? What should be done if the assumptions and predictions on which the approval was based turn out to be based on misleading or false information?
Why were the community's views not shown more respect by decision makers in NSW Planning? Consultation without respect is meaningless. An EIS that is controlled by Sydney Motorway Corporation and conducted by a company AECOM that has a big commercial in WestCONnex, was bound to present the material in a positive way. I'm not suggesting that information was falsified but that the process was limited and hopelessly biased towards approving the project without sufficient protection for the community. For more on AECOM's role, read one of my investigations published in New Matilda or this piece by Carmen Lawrence .)
What is the situation at other WestConnex construction sites in St Peters, Arncliffe, and Kingsgrove where there are no monitoring reports available? Or further West on the widened M4 at Auburn North Public School that lies on a narrow strip of land between the WestConnex M4 and Parramatta Rd, which is busier since tolls were imposed on the widened M4.
Originally Haberfield residents were promised that there would be no major above-ground construction in Haberfield even if Stage 3 was approved. But this has now changed. If Stage 3 is approved, WestCONnex wants to establish a major construction site even closer to the school on the corner of Bland Street and Parramatta Rd. This Stage 3 proposal is currently being actively considered by NSW Planning. We must try to stop its approval. In the light of the evidence available, I find it hard to believe that any responsible person could approve these sites.
How much worse will the air quality get when the tunnels are opened? How many people will suffer life-threatening health illnesses or other health problems as a result of WestConnex, NorthConnex and other major road projects? What about the apartments on the southern side of Parramatta Rd where there is no monitor? WestConnex tore down buildings that sheltered these buildings from Parramatta Rd traffic and now they look directly over the construction site.
The community needs more independent experts on their side. Many health experts warn against the health impacts of car dependency and massive road projects but detailed professional research and analysis on specific locations need time and money. Many environmental firms only work for big government and corporate players. Is there a role for citizen scientists that could amplify the work of independent scientists?
If you start following the website, you'll find that there are quite a few negative results, mostly for PM 10. You obviously can't have negative PM. The community needs to know how these odd readings affect the overall findings and what a negative reading at one point of time means for the readings shortly before or afterward. Do these get adjusted upwards later? I contacted two industry sources who did not wish to be named. Both confirmed they are errors. One attributed the errors to intense moisture. The other said it could be moisture but could also be caused by other factors. Extremely positive results of 985 also occasionally appear and I have assumed those as errors which also need explaining.
This is a complex situation that needs more media attention. If any other journalist needs information, I am happy to share information.
Research support: Luke Bacon
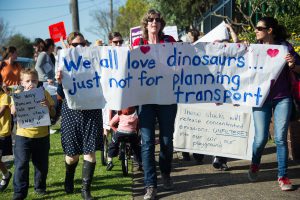
Thanks to Lorrie Graham for 2015 photos of children protesting in Haberfield
*Note: Since I published this article, I have spoken to more air quality experts who say that negative results, especially in very damp conditions, are not unusual. The levels can shoot up and down quite rapidly. But I am yet to find anyone who has found the number of very high negatives occurring persistently as on these Ecotech monitors. I later wrote this report. After this report, the negative results dramatically decreased. But at one stage there were many repeating 985 PM 2.5 results. What is needed is more independent advice for community groups grappling with interpreting air quality data.